Tuesday, August 15, 2006

Tweaking The Registration

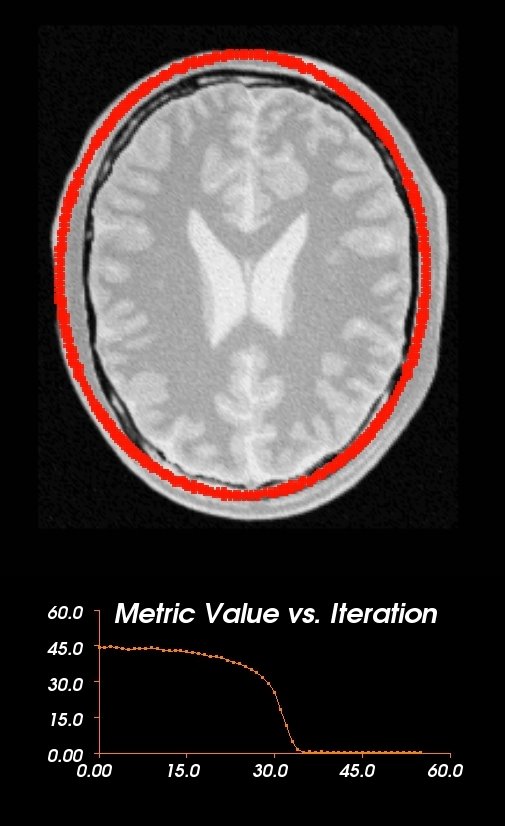
To improve the performance of the Image Registration process, I have added various changes in its structure and implementation. The addition of a user selectable blurring option was included in hopes of smoothing out the optimizer's path. I have been running the itkBinomialBlurImageFilter at twenty iterations, providing an image with its borders slightly blurred. The point set that represents the ellipse has also been shrunk to a smaller band size. Reducing the size of the ellipse band has made the metric more sensitive to every perturbation. It has resulted in the metric being very choppy. I have implemented the Registration in steps, first the translation, then the angle, and finally translation again. The first translation is allowed to move freely, with the optimizer starting at the ability to jump thirty pixels. After this is run the coordinates of the ellipse are usually in roughly the correct position. Then I run a second Registration where the angle is the parameter in question. Once that is completed, I run a third where the translation is again computed, but this time allowed an initial movement of just two pixels. This has allowed for the ability to fine tune a rough set of parameters gradually and incrementally. Although one pervasive issue throughout the process is the vacillating of the metric. It consistently is very unstable in both the translation and orientation processes.

The following is a movie of the Registration process:


Friday, August 11, 2006

Graphical Transformation Of Points

Today I completed the implementation of the graphical transformation of the points that represent the ellipse in the Registration process I am currently using. The ellipse is a simple itkSpatialObject that can be used to represent the outline of the brain. In my previous Registration, the ellipse fit the brain exactly in size but was placed a few pixels away from the correct location. Thus the process of the Registration only focused on the translation of the points. Now, I have added functionality by using the itkSimilarity2DTransform which contains scaling, rotation, and translation. Previously I had loaded all the points from the ellipse into a vtkPolyData object and used a vtkActor and vtkPolyDataMapper to display the ellipse. To represent the effects of translation I created a function designed to move the vtkActor with respect to the different locations outputted from the Registration process. This was done by simply changing the position settings on the desired actor. To take into account all the aspects of the itkSimilarity2DTransform, I needed to transform the set of points to new locations in space. This was accomplished by instantiating a new transform object with the parameters from the current iteration. Using that, I transformed each point before I placed it into the vtkPolyData object and then reloaded the object into its respective actor. These additional computations did not noticeably reduce the speed of the Registration process. With the transform implemented I no longer needed to access the coordinates of the translation in the display function, since the positioning of the object was already taken care of within the transform.

The results of the Registration using the itkSimilarity2DTransform varied. At times, using initial conditions where the translation was displaced twenty-five pixels with a rotation of fifteen degrees, the end of the registration would find itself within five pixels of the correct transformation. Other times the Registration would end abruptly having made not significant strides into the correct direction. I tried blurring the image using itkBinomialBlurImageFilter, which provided some improvement. If scaling is allowed to vary greatly, the registration process basically stands still and makes no progress. I will probably try to register each aspect of the transformation in succession and use different degrees of blurring.

Thursday, August 10, 2006

Movie Of Registration

A copy of the Registration process movie can be found here.

To construct a movie of the Registration process I implemented the vtkWindowToImageFilter that would take the output of the renderer and convert that to the VTK image type. Using the image type as the input to vtkTIFFWriter I was able to create a series of images that represented each succeeding step in the registration process. Then, to turn those images into a movie I used the "convert" command which comes with the ImageMagick suite and should be available with most versions of linux. I used the command "convert *.tif reg.mpg" to create the movie but came upon the error: Delegate failed `"mpeg2encode" "%i" "%o". I resolved the problem by finding that the converter lacked the required codecs to encode the MPEG movie and added them using the following commands:

wget ftp://ftp.mpegtv.com/pub/mpeg/mssg/mpeg2vidcodec_v12.tar.gz
tar xvzf mpeg2vidcodec_v12.tar.gz
cd mpeg2
make
cd src/mpeg2dec
cp mpeg2decode /usr/local/bin
cd ../mpeg2enc
cp mpeg2encode /usr/local/bin

For viewing the MPEG movies the Berkeley MPEG Player worked well since it was really easy to set up. My initial movies were much too fast to be useful. To alleviate this issue I constructed a movie using three images depicting the same information for each iteration. This allowed the movie to proceed at a slower pace.

Wednesday, August 09, 2006

vtkXYPlotActor Working

The above is a snapshot of the final iteration in the Registration process that features the now working vtkXYPlotActor and all my previous implementation of the point set and the brain image registration.


I was finally able to get vtkPlotActor to work properly. The problem was in the ordering of the linked libraries in the CMakeLists.txt file that is used by CMake. It seems that if a library is listed last, then anything dependent on it will not be able to define itself properly. Another issue could have been that certain objects were being defined multiple times to further cause errors. So once I was able to remove all the 'undeclared reference' errors I could then begin experimenting with what the vtkXYPlotActor was capable of doing. It seems to be a very versatile class with the ability for the axes to be scaled to whatever a user designated or for it to automatically compensate for the appropriate amount of space for the points. Using these tools, I can scale the y-axis whenever there are points that overreach a certain boundary. The class also contains incremental labels for both axes where the user can specify a number that the class will try to adhere. There is also infrastructure to allow for the separate coloring of the labels and the lines. The input of the graph is in the form of a vtkPolyData object where the scalars are the values for each of the y-axis points. So when plotting, it will take the scalars as the y-points and the point number in the data structure as the x-points. Compared to actually building a vtkPolyData object using points, cells, scalars, and connections between points, this is much easier. I was also able to fit it in nicely into my real time registration structure by simply reloading the vtkPolyData every iteration.

Now that these steps have been completed, I am beginning to try to figure out how to introduce the ability to scroll through the x-axis. Basically, be able to increase the length of the graph in the x direction but still have it be contained in the same space. This may be possible by introducing the VTK widgets that allow for user control of certain aspects of the graphics. The other step is to be able to transform the set of points in the registration and then display them. In the metric, this is done one point at a time and that may be the only way. Because of all this added computation, the registration process may turn out to be very slow.

Monday, August 07, 2006

Additions To vtkGraph

I have now added text into my graph implementation using the vtkTextMapper class. It seems to work very well for the purpose with the ability to change the color and size easily, it even has functions that enable the text to be centered to allow for the appropriate format of the text even if the content changes. One difficulty with this class was using its orientation function that allows for the change of the angle of the text by specifying the desired orientation in degrees. When I tried to edit this there was no apparent result. I had planned to display the y-axis label vertically using this function. Now that the labeling has been pretty much completed, I had moved onto the axis that I first tried to display using vtkAxisActor2D, but I have had a terrible time trying to get it to display. The other solution would be to use vtkLine to create the axis. As far as the scaling of the y-axis was concerned, I plan to scale all of the points by a certain amount every time the points reach an upper boundary.


The vtkXYPlotActor itself has much of the functionality that I am trying to recreate. To alleviate some of the issues that I have been having with it to get it to work with Linux I have declared some of the undeclared referenced classes in the calling program and that has helped with many of the errors. Then I came upon difficulties with the vtkMapper2D that I am having trouble declaring properly. It seems that the problem stems from some of the libraries in VTK are not being declared properly in the context of this class. I tried recompiling VTK with turning off the shared libraries and setting the path name correctly but neither seemed to help.

Friday, August 04, 2006

Graph Using vtkXYPlotActor

The preceding graph was made using the VTK class vtkXYPlotActor. It is able to represent the points as a line and has a nice way to label the axis. The problem is that I was only able to get the class working in Windows. In Linux the compiler would complain every time it would start linking, I am not sure why it is doing that so I have been taking elements from this graph and putting them into my own graph class. The labels suit the purpose very well in that they are much clearer then using a .png file for the background. One issue with it is that it uses the vtkAxisActor2D, and by looking at the above graph it can readily be seen that it is not working properly. The areas where the label is "HPQ" should be the value of the position at that point in the axis. When I tried using the class alone it would not even display properly. This class, if it does what it purports to do, would save a great deal of time in creating my graph class.

Once these problems have been solved, I can start working on making the desired points into a vtkDataSet that is the input the line would take. Either points or a smooth line can represent the line. These specific graphs classes seem to be less robust then the other more standard VTK classes and it might be due to being platform dependant or the classes it depends on being altered as VTK has been updated.

Thursday, August 03, 2006

Creating A Two-Dimensional Plot

I am now starting to create a class that will visualize a two-dimensional graph using the VTK interface. VTK itself comes with a class that supposedly has a good deal of the functionality that I am trying to create but I have yet to get it to work. Currently I have a basic class created that will display a graph given points, but the background is a .png file which has to be drawn by hand specifically for the data set that will be used for the graph. One aspect that separates my class from the one available in the VTK setup is the ability to display the graph point by point which can be used to create a movie of the graph creation in real time. This is helpful in the process of registration where the parameters are being computed on the fly and the visual interface serves to show how the results are changing.

With the new 2DGraph class that I am creating, I am also looking to add the functionality of having the ability to scale itself in the y-direction if the points are specified at locations above the limit. Another addition would be the ability to scroll in the x-direction and have a grid in the background. One issue with implementing these things is the fact that the resolution of the objects being displayed is so low. This causes problems with labels being unclear and the lack of detail that can be implemented. To assist in these goals I am trying to milk some of the functionality of the vtkXYPlotActor that is provided but so far, it has been difficult to get it up and running. The VTK documentation does provide one example piece of code that was written in python, I converted it to C++ but was still unable to get it to run due to problems with the vtkXYPlotActor itself not being able to compile because of "undeclared references" to the initiation of certain objects.

Below is a picture of the graph interface that I have implemented so far.