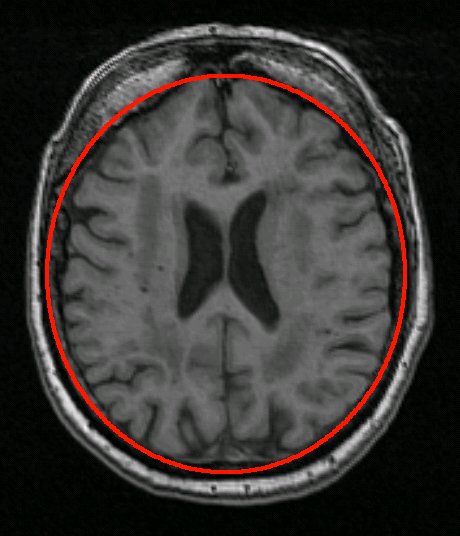
Registration Using Intenisty Profiles
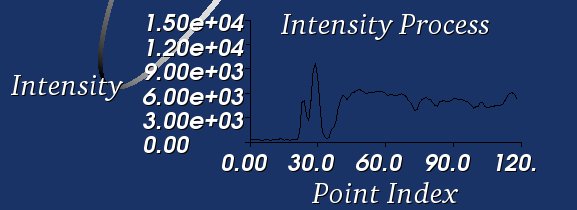
To test out the registration I began by starting the ring that I am using ten pixels away from the optimal location. Then I implemented the intensity profile metric using the intensities at just one point in the ring. The metric value was calculated by taking the intensities at that point during each step of the registration and finding the least squares error between the model I had created for the intensities when the model was in the optimal location of the image. The preceding movie shows the metric smoothly converging to the correct value since in this case I am using just one point in the model instead of all the points the errors in my model fitting aren't overwhelming the metric value which had been a problem.
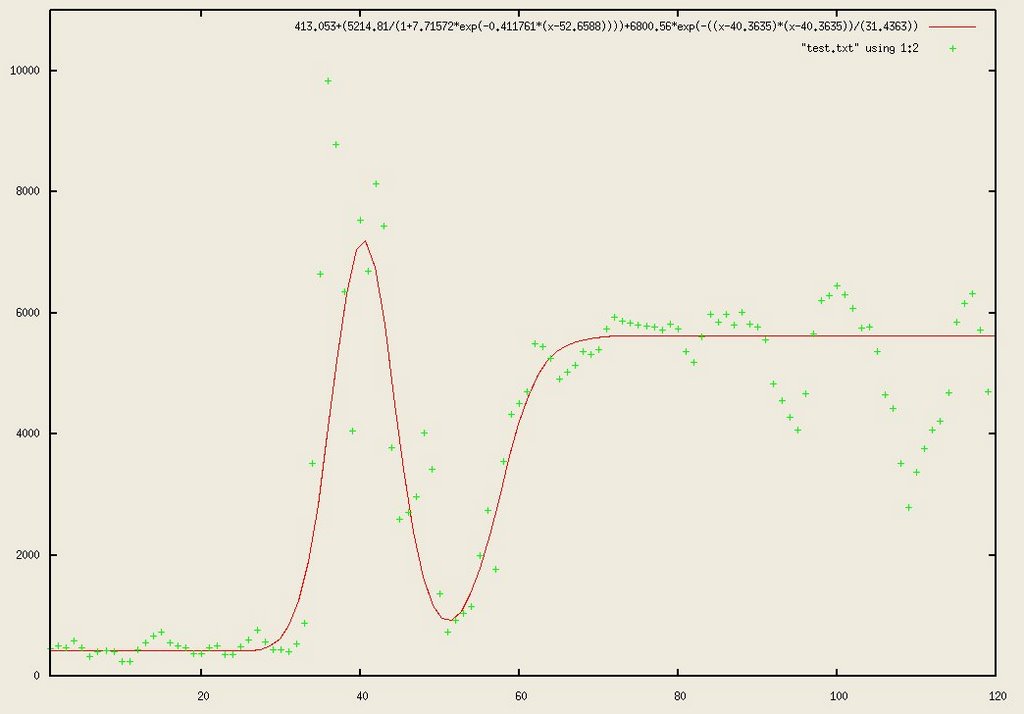
To create the model I use a Gaussing plus a Logistic function as illustrated in the following equation
 To fit all of the parameters I wrote a C++ program that would find all the peaks by looking at the first derivative using surrounding points and then finding the most significant one by looking at the second derivative. The beginning of the logistic was found using a similar method. To find the rest of the parameters I started out using values roughly in the range of the correct ones and then exhaustively tried different combinations to find the optimal fit. The previous post shows some examples of how well the fit is with some of the data.
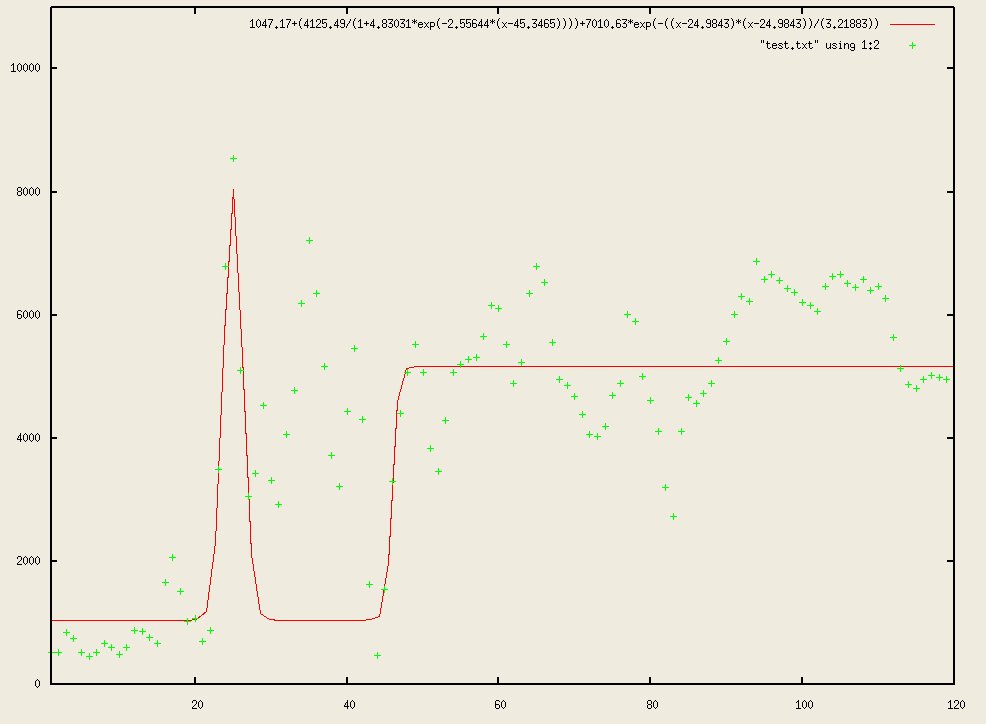
When gathering data from the intensities around points from the ring, most conform to the Gaussian-Logistic model except the top and bottom of the ring which is more of two Gaussian functions as illustrated in the following graph
 To alleviate this issue the fitting code can be augmented to take into account model selection to see whether a different combinations of Gaussian and logistic functions would work better.
posted by Gautam Prasad @ 4:45 PM
0 comments
![]()