Creating A Two-Dimensional Plot
I am now starting to create a class that will visualize a two-dimensional graph using the VTK interface. VTK itself comes with a class that supposedly has a good deal of the functionality that I am trying to create but I have yet to get it to work. Currently I have a basic class created that will display a graph given points, but the background is a .png file which has to be drawn by hand specifically for the data set that will be used for the graph. One aspect that separates my class from the one available in the VTK setup is the ability to display the graph point by point which can be used to create a movie of the graph creation in real time. This is helpful in the process of registration where the parameters are being computed on the fly and the visual interface serves to show how the results are changing.
With the new 2DGraph class that I am creating, I am also looking to add the functionality of having the ability to scale itself in the y-direction if the points are specified at locations above the limit. Another addition would be the ability to scroll in the x-direction and have a grid in the background. One issue with implementing these things is the fact that the resolution of the objects being displayed is so low. This causes problems with labels being unclear and the lack of detail that can be implemented. To assist in these goals I am trying to milk some of the functionality of the vtkXYPlotActor that is provided but so far, it has been difficult to get it up and running. The VTK documentation does provide one example piece of code that was written in python, I converted it to C++ but was still unable to get it to run due to problems with the vtkXYPlotActor itself not being able to compile because of "undeclared references" to the initiation of certain objects.
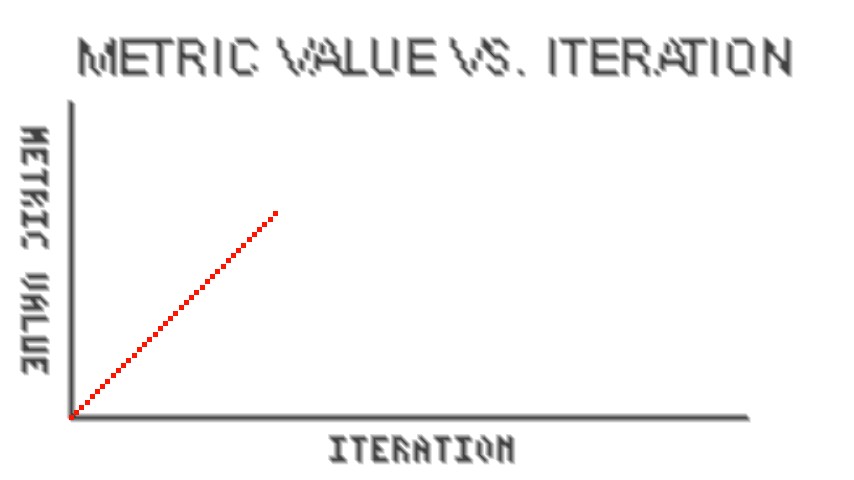
Below is a picture of the graph interface that I have implemented so far.
With the new 2DGraph class that I am creating, I am also looking to add the functionality of having the ability to scale itself in the y-direction if the points are specified at locations above the limit. Another addition would be the ability to scroll in the x-direction and have a grid in the background. One issue with implementing these things is the fact that the resolution of the objects being displayed is so low. This causes problems with labels being unclear and the lack of detail that can be implemented. To assist in these goals I am trying to milk some of the functionality of the vtkXYPlotActor that is provided but so far, it has been difficult to get it up and running. The VTK documentation does provide one example piece of code that was written in python, I converted it to C++ but was still unable to get it to run due to problems with the vtkXYPlotActor itself not being able to compile because of "undeclared references" to the initiation of certain objects.
Below is a picture of the graph interface that I have implemented so far.
posted by Gautam Prasad @ 2:56 PM
1 comments
![]()

1 Comments:
gautam IS TIGHT!
Post a Comment
<< Home