vtkXYPlotActor Working
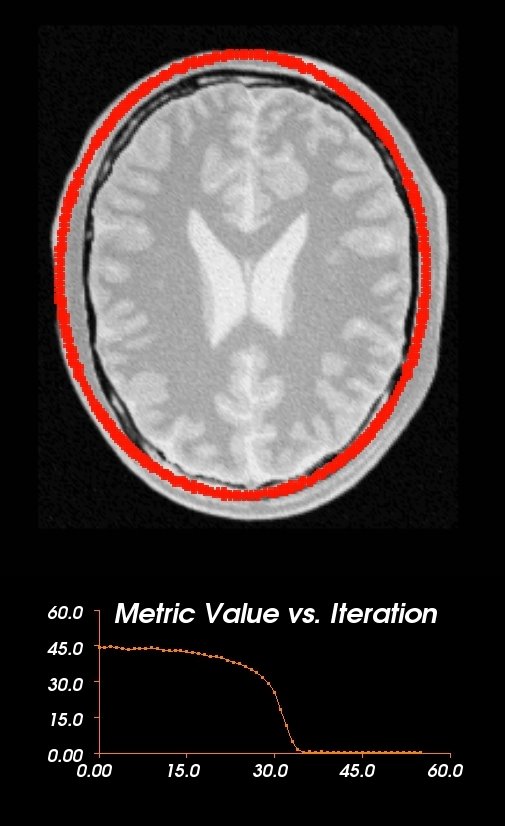
The above is a snapshot of the final iteration in the Registration process that features the now working vtkXYPlotActor and all my previous implementation of the point set and the brain image registration.
I was finally able to get vtkPlotActor to work properly. The problem was in the ordering of the linked libraries in the CMakeLists.txt file that is used by CMake. It seems that if a library is listed last, then anything dependent on it will not be able to define itself properly. Another issue could have been that certain objects were being defined multiple times to further cause errors. So once I was able to remove all the 'undeclared reference' errors I could then begin experimenting with what the vtkXYPlotActor was capable of doing. It seems to be a very versatile class with the ability for the axes to be scaled to whatever a user designated or for it to automatically compensate for the appropriate amount of space for the points. Using these tools, I can scale the y-axis whenever there are points that overreach a certain boundary. The class also contains incremental labels for both axes where the user can specify a number that the class will try to adhere. There is also infrastructure to allow for the separate coloring of the labels and the lines. The input of the graph is in the form of a vtkPolyData object where the scalars are the values for each of the y-axis points. So when plotting, it will take the scalars as the y-points and the point number in the data structure as the x-points. Compared to actually building a vtkPolyData object using points, cells, scalars, and connections between points, this is much easier. I was also able to fit it in nicely into my real time registration structure by simply reloading the vtkPolyData every iteration.
Now that these steps have been completed, I am beginning to try to figure out how to introduce the ability to scroll through the x-axis. Basically, be able to increase the length of the graph in the x direction but still have it be contained in the same space. This may be possible by introducing the VTK widgets that allow for user control of certain aspects of the graphics. The other step is to be able to transform the set of points in the registration and then display them. In the metric, this is done one point at a time and that may be the only way. Because of all this added computation, the registration process may turn out to be very slow.
posted by Gautam Prasad @ 3:58 PM
0 comments
![]()

0 Comments:
Post a Comment
<< Home