Graph Using vtkXYPlotActor
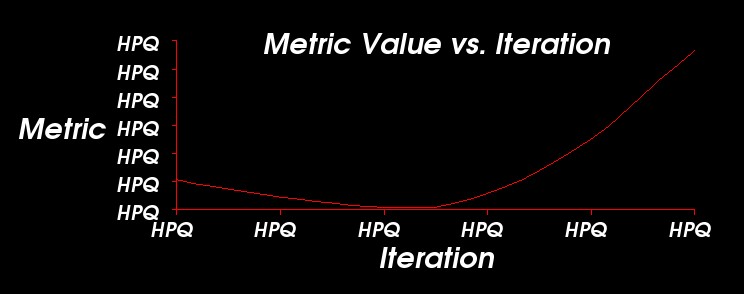
The preceding graph was made using the VTK class vtkXYPlotActor. It is able to represent the points as a line and has a nice way to label the axis. The problem is that I was only able to get the class working in Windows. In Linux the compiler would complain every time it would start linking, I am not sure why it is doing that so I have been taking elements from this graph and putting them into my own graph class. The labels suit the purpose very well in that they are much clearer then using a .png file for the background. One issue with it is that it uses the vtkAxisActor2D, and by looking at the above graph it can readily be seen that it is not working properly. The areas where the label is "HPQ" should be the value of the position at that point in the axis. When I tried using the class alone it would not even display properly. This class, if it does what it purports to do, would save a great deal of time in creating my graph class.
Once these problems have been solved, I can start working on making the desired points into a vtkDataSet that is the input the line would take. Either points or a smooth line can represent the line. These specific graphs classes seem to be less robust then the other more standard VTK classes and it might be due to being platform dependant or the classes it depends on being altered as VTK has been updated.
posted by Gautam Prasad @ 11:20 PM
3 comments
![]()

3 Comments:
Hi!
I just read your post about the vtkXYPlotActor. I am developing and application that uses that widget too, my graph didn't turn out as fancy as yours,¿Could you send me that part of the code? My email is tomas.aguado@gsyc.escet.urjc.es, the one I used is:
resultPool::resultPool* results = getResultPool(name);
//Now let's plot the testPool
if (!results->getNumResults())
return;
vtkFieldData *fieldData = vtkFieldData::New();
vtkDataArray *dataArray = vtkDataArray::CreateDataArray(VTK_FLOAT);
vector result::result*> resultList = results->getResultList();
fieldData->AllocateArrays(resultList.size());
int DIM = resultList[0]->getResults().size();
dataArray->SetNumberOfTuples(DIM);
int k=0;
for (int t = 0; t < DIM; t++)
{
k+=4;
float x = k;
dataArray->SetTuple(t, &x);
}
fieldData->AddArray(dataArray);
for(int i=0;i less resultList.size();i++){
fieldData->AddArray(resultList[i]->toVtkDataArray());
}
vtkDataObject *dataObject = vtkDataObject::New();
dataObject->SetFieldData(fieldData);
vtkRenderer* ren = vtkRenderer::New();
vtkXYPlotActor *plot = vtkXYPlotActor::New();
plot->AddDataObjectInput(dataObject);
plot->SetTitle("Current CMP time for 4x4 increasing pixel images");
plot->SetXTitle("Time\n(Microseconds)");
plot->SetYTitle("Image Size\n(Pixels)");
plot->SetXValuesToValue();
plot->SetWidth(0.9);
plot->SetHeight(0.9);
plot->SetPosition(0.05, 0.05);
plot->LegendOn();
vtkTextProperty* v = vtkTextProperty::New();
v->SetColor(0,0,0);
plot->SetAxisTitleTextProperty(v);
plot->PickableOff();
plot->SetDataObjectXComponent(0, 0);
plot->SetDataObjectYComponent(0, 1);
plot->SetPlotColor(0, 1.0, 0.0, 0.0);
plot->SetPlotLabel(0, "");
plot->GetProperty()->SetColor(1.0, 0.0, 0.0);
ren->SetBackground(1.0, 1.0, 1.0);
ren->AddActor2D(plot);
vtkRenderWindowInteractor* iren =vtkRenderWindowInteractor::New();
vtkRenderWindow* renwin =vtkRenderWindow::New();
iren->SetRenderWindow(renwin);
renwin->SetSize(1024,768);
renwin->AddRenderer(ren);
renwin->Render();
iren->Start();
renwin->Delete();
iren->Delete();
Sorry the correct email is:
taguado@gsyc.escet.urjc.es
If you look at the vtkXYPlotActor documentation, there is an example on how to use the class. The example contains what you need to display the graph I created. However, the only example I have seen was in python, so here is the crux of the code in C++.
xyplot3->AddInput(points);
xyplot3->GetPositionCoordinate()->SetValue(0.24, 0.05, 0); //Position is taken as a fraction of the viewing area.
xyplot3->GetPosition2Coordinate()->SetValue(.55, 0.20, 0); //Relative to Position
xyplot3->SetXValuesToIndex();
xyplot3->SetNumberOfXLabels(6);
xyplot3->SetTitle("Graph Title");
xyplot3->SetXTitle("");
xyplot3->SetYTitle("");
xyplot3->SetYRange(0, 60);
xyplot3->SetXRange(0, 60);
xyplot3->PlotPointsOn();
xyplot3->GetProperty()->SetColor(1, .5, 0);
xyplot3->GetProperty()->SetPointSize(3);
vtkTextProperty *tprop;
tprop = xyplot3->GetTitleTextProperty(); //Created for the purpose of setting the color of the labesls.
tprop->SetColor(1,1,1); //Set the color of the labels
xyplot3->SetAxisTitleTextProperty(tprop);
xyplot3->SetAxisLabelTextProperty(tprop);
renderer->AddActor(xyplot3);
Post a Comment
<< Home