Fitting Intensity Profiles
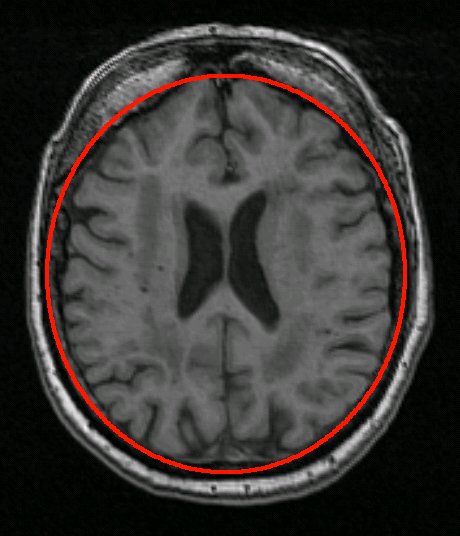 Using the set up in the receding image, I was able to extract intensities along the red ellipse in the image. I have used a sampling range of 120 pixels to extract data. To accomplish this I implemented the intensity profile class that I had to change slightly to make sure that all the intensities were coming from the outside into the brain so that I could compose a regular model for the data. Once this was done I looked at the graphs of the average intensities that resembled the following graph.
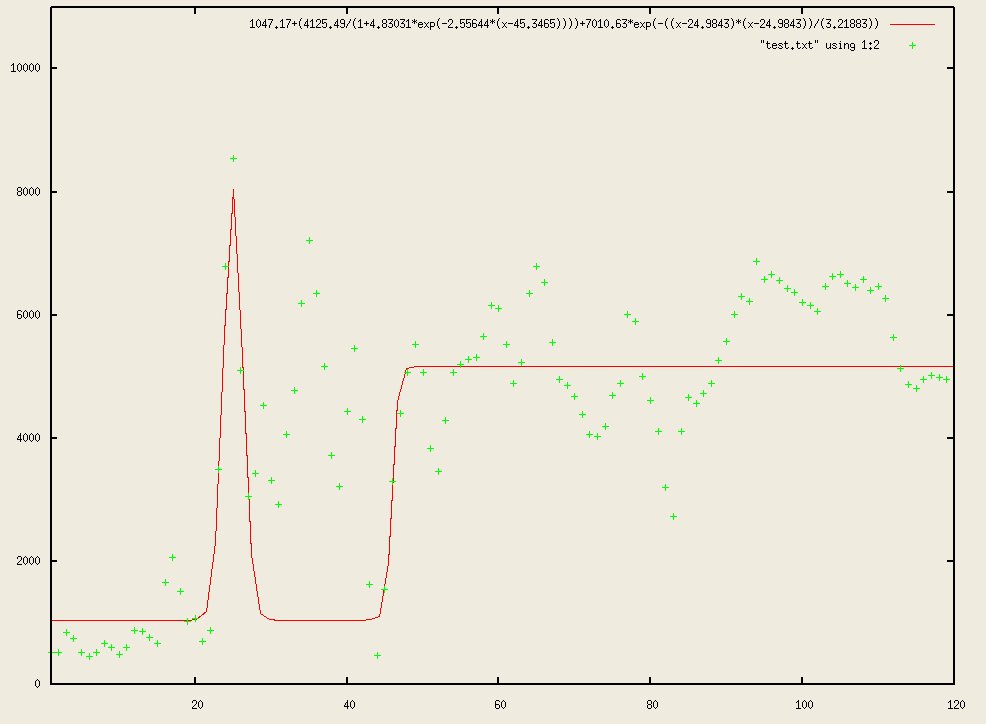
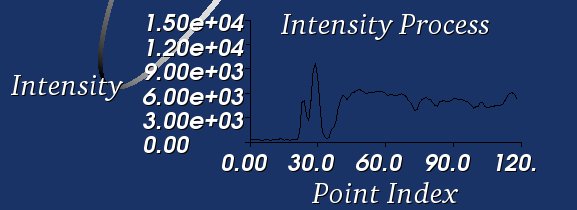 I had initially tried to model the intensities using two Gaussians along with a logistic, but after experimenting with various data I found that some of the data contained up to five Gaussians and some with just one. But usually there was one main Gaussian, so I changed my model to used one Gaussian and one logistic. The following two graphs represent the models that I created in the red color and the data in the green. In some cases I was able to get the model to fit very well in the case of the first graph, but others the match was not as good. I constructed this by making a C++ code that would find the Gaussians by looking at the derivative and second derivative of points to fins it, then I would give a rough estimate for the rest of the parameters in the Gaussian and logistic and many different combinations till I came up with a reasonable one.
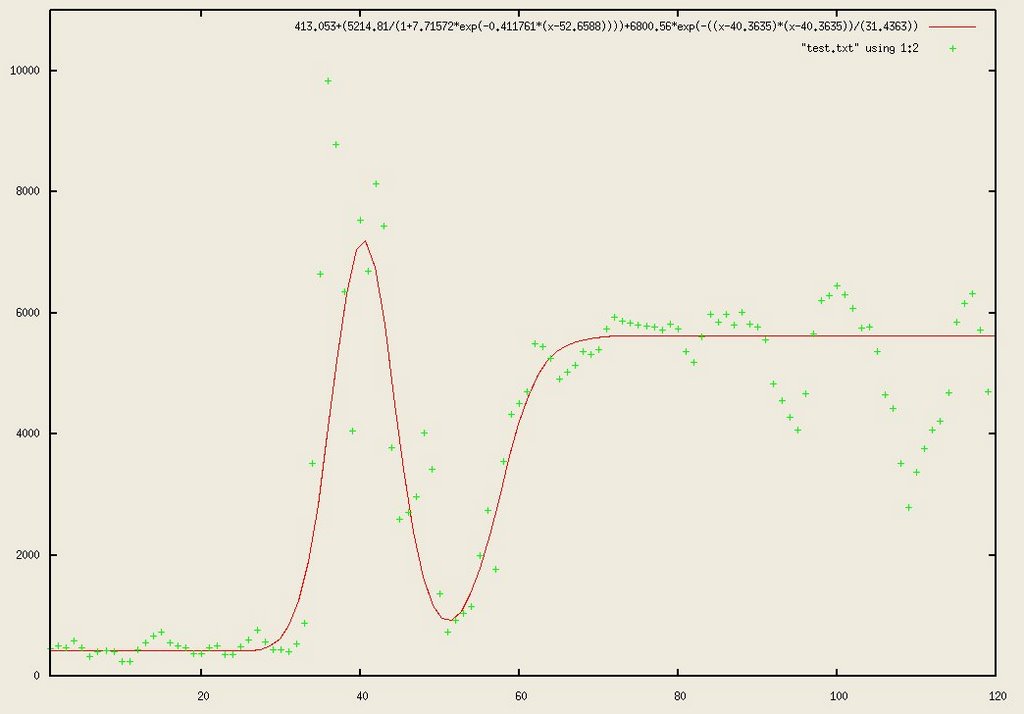
 I also added all the intensity profiles into the registration process where I took a sampling of every tenth face in my ring structure and calculated the intensities of the image at that point compared with the model and then took the least squares error and added it up for each face as the metric value. Right now it seems to be stable if I make the optimizer's movements very minor, but I am not sure whether that is significant.
posted by Gautam Prasad @ 9:15 PM
0 comments
![]()

0 Comments:
Post a Comment
<< Home