Visualizing Intensity Profiles
 After completing the conversion of the itkMesh to a vtkPolyData and the calculation of the normals from the mesh, I started working with the intensity profile visualizer to analyze what the intensities look like. I was able to pass the class my itkMesh and vtkMesh directly to set up the visualization. The normals were read in from a file that I had made from the registration process, although this can be changed to get the normals directly from the mesh being looked at. One issue that needed to be dealt with was the offset of the mesh to make sure that it was in range with the image to calculate the intensities. I had kept getting a segmentation fault error that was probably due to the points in the mesh out of the image’s range. Adding an offset to each point in the mesh was able to help keep the mesh in range of the image. There were also some issues with the cells being undefined at certain points that has to due with how I initialized them and the count that I used to iterate through the points.
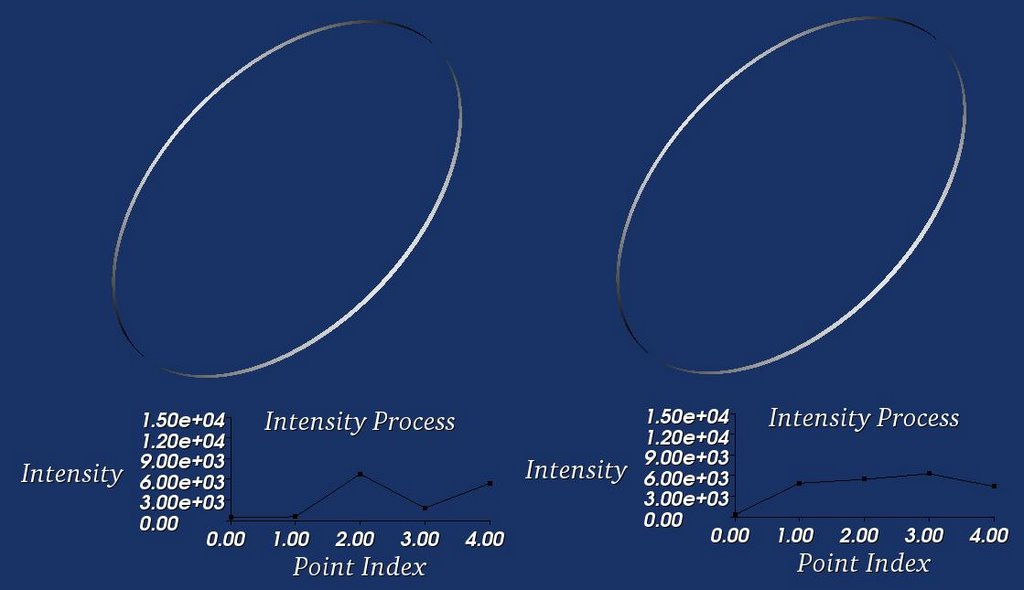
I was able to view some of the intensity profiles as seen in the above pictures of my three-dimensional ring that uses triangular faces on the edge to get normals to use to find the intensities at certain areas in the image. These initial profiles are not uniformly distributed throughout the image because the points could be better positioned around the skull area. To find the optimal value I will need to run the registration process again using the points to figure out the best possible position so as to get a better idea of where I can extract a general shape of the intensity profiles of the image.
posted by Gautam Prasad @ 6:21 PM
0 comments
![]()

0 Comments:
Post a Comment
<< Home